The January-June period was the warmest first half of any year on record for the contiguous United States, reports NOAA in its June 2012 overview. The national temperature of 52.9°F was 4.5°F (2.5°C) above average.

The United States Department of Agriculture has designated 1,016 primary counties in 26 states as natural disaster areas, making it the largest natural disaster in America ever.
 The U.S. Drought Monitor has declared 80% of the Contiguous U.S. to be abnormally dry or worse, with 61% experiencing drought conditions ranging from moderate to exceptional—the largest percentage in the 12-year history of the service.
 NOAA reports record temperatures in many places; in Mc Cook, Neb., it was 115°F (46°C) on June 26, while in Norton Dam, Kan., it was 118°F (48°C) on June 28. Meanwhile, it was 126°F (52°C) in Death Valley National Park on July 10, 2012.

 Earlier this year, in March 2012, another heatwave hit much the same area. A NOAA analysis of the heatwave notes the abrupt onset of the warmth at Minneapolis, Duluth, and International Falls on 10 March. On subsequent days, anomalies of well over 20°C (36°F) were recorded as shown on the image on the right.
Temperature anomalies of 27+°F (15+°C) were recorded in a large area from March 12th to March 23rd, 2012, as shown below.

Global warming is responsible for much of the frequency and intensity of extreme weather events and this is linked to developments in the Arctic, where accelerated warming is changing the jet stream, concludes an analysis by Rutgers University professor Jennifer Francis.
Apart from the obvious impact that droughts and heatwaves have on food and fresh water supply, they also come with wildfires that cause additional emissions, constituting a further positive feedback that further contributes to global warming, while the additional soot makes things even worse in the Arctic.
All this combines to create a situation in the Arctic where extreme local warming events can trigger methane releases, causing further local warming and further releases of methane, in a vicious cycle that threatens to escalate into runaway global warming that feeds on itself.

The above image pictures the three kinds of warming (red lines) and their main causes:
- Emissions by people cause global warming, with temperatures rising around the globe, including the Arctic.
- Soot, dust and volatile organic compounds settle down on snow and ice, causing albedo change. More heat is absorbed, rather than reflected as was previously the case. This causes accelerated warming in the Arctic.
- Accelerated warming in the Arctic threatens to weaken methane stores in the Arctic with the danger that releases will cause runaway global warming.
In addition, there are at least three feedback effects (gold lines) that make things even worse:
- Fires feedback: Accelerated warming in the Arctic is changing the Jet Stream, contributing to increased frequency and intensity of droughts and heatwaves.
- Albedo feedback: Accelerated warming in the Arctic also speeds up the decline of ice and snow cover, further accelerating albedo change.
- Methane feedback: Methane releases in the Arctic further add to the acceleration of warming in the Arctic, further contributing to weaken Arctic methane stores, in a vicious cycle that threatens to escalate into runaway global warming.

Rapid warming periods in the past constitute an ominous warning. In a paper published about a year ago, Ruhl et al. conclude that the end-Triassic mass extinction, about 200 million years ago, started with global warming due to carbon dioxide from volcanoes. This also caused warming of oceans and melting of hydrates at the bottom of the sea, containing methane created by millions of years of decomposing sea life. The hydrates released some 12,000 gigatons of methane, causing global warming to accelerate and resulting in sudden extinction of about half the species on Earth at the time.
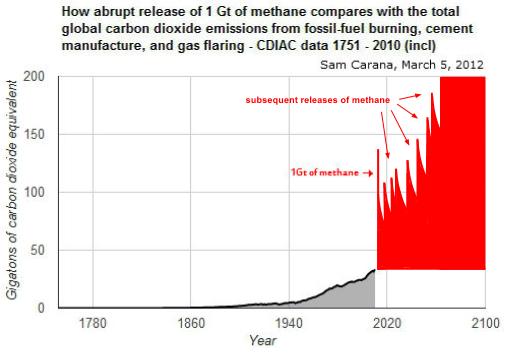

The above image pictures how a similar thing could happen in our times, with global warming leading to accelerated warming in the Arctic, triggering hydrate destabilization and abrupt release of, say, 1 Gt of methane, which would further accelerate Arctic warming and lead to subsequent releases of methane from hydrates.
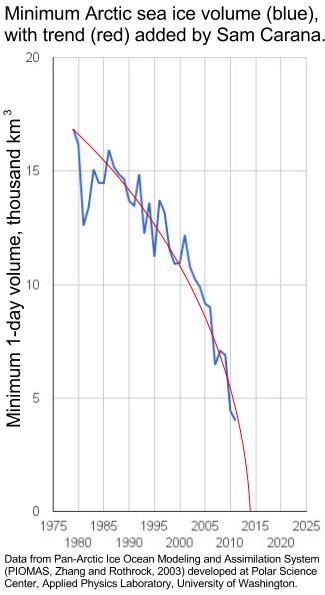
For more details on above two graphs, see the page How much time is there left to act?
Could extreme weather, like the U.S. is now experiencing, also occur in the Arctic?
Well, it actually did, not too long ago. Above image on the right, from the Cryosphere Today, shows air temperature anomalies in the Arctic of up to 6°C (10.8°F) for the month September 2007.
 By how much will the sea warm up during such extreme local warming events?
The image on the right, produced with NOAA data, shows mean coastal sea surface temperatures of over 10°C (50°F) in some areas in the Arctic on August 22, 2007.
How extreme was this?
The image below, from NOAA, shows that sea surface temperature anomalies of over 5.5 were recorded for August 2007 in some areas in the Arctic.

Could such warming reach the bottom of the sea?
Again, this did happen in 2007, when strong polynya activity caused more summertime open water in the Laptev Sea, in turn causing more vertical mixing of the water column during storms in late 2007, according to one study, and bottom water temperatures on the mid-shelf increased by more than 3°C (5.4°F) compared to the long-term mean.
Another study finds that drastic sea ice shrinkage causes increase in storm activities and deepening of the wind-wave-mixing layer down to depth ~50 m (164 ft) that enhance methane release from the water column to the atmosphere. Indeed, the danger is that heat will warm up sediments under the sea, containing methane in hydrates and as free gas, causing large amounts of this methane to escape rather abruptly into the atmosphere.
Would this heat be able to penetrate sediments?
 The image on the right, from a study by Hovland et al., shows that hydrates can exist at the end of conduits in the sediment, formed when methane did escape from such hydrates in the past. Heat can travel down such conduits relatively fast, warming up the hydrates and destabilizing them in the process, which can result in huge abrupt releases of methane.
Since waters can be very shallow in the Arctic, much of the methane can rise up through these waters without getting oxidized.
Shakova and Semiletov warn, in a 2010 presentation, that some 75% of the East Siberian Arctic Shelf (ESAS) is shallower than 50 m, as shown on the image below. Furthermore, the ESAS region alone has an accumulated methane potential of some 1700 Gt in the form of free gas and hydrates under the sediment, in addition to organic carbon in its permafrost.

As the methane causes further warming in the atmosphere, this will contribute to the danger of even further methane escaping, further accelerating local warming, in a vicious cycle that can lead to catastrophic conditions well beyond the Arctic.

Above image shows the carbon in the melting permafrost, estimated by Schuur et al. at 1700 Gt. Much of this carbon could also be released as methane under warmer and wetter conditions.
Under warmer and dry conditions, things wouldn't be much better. The 2010 heatwave in Russia provides a gloomy preview of what could happen as temperatures rise at high latitudes. Firestorms in the peat-lands, tundras and forests in Siberia could release huge amounts of emissions, including soot, much of which could settle on the ice in the Himalaya Tibetan plateau, melting the glaciers there and causing short-term flooding, followed by rapid decline of the flow of ten of Asia's largest river systems that originate there, with more than a billion people's livelihoods depending on the continued flow of this water.
For more details on above two graphs, see the page How much time is there left to act?
Could extreme weather, like the U.S. is now experiencing, also occur in the Arctic?
Well, it actually did, not too long ago. Above image on the right, from the Cryosphere Today, shows air temperature anomalies in the Arctic of up to 6°C (10.8°F) for the month September 2007.
By how much will the sea warm up during such extreme local warming events? The image on the right, produced with NOAA data, shows mean coastal sea surface temperatures of over 10°C (50°F) in some areas in the Arctic on August 22, 2007.
How extreme was this?
The image below, from NOAA, shows that sea surface temperature anomalies of over 5.5 were recorded for August 2007 in some areas in the Arctic.
Could such warming reach the bottom of the sea?
Again, this did happen in 2007, when strong polynya activity caused more summertime open water in the Laptev Sea, in turn causing more vertical mixing of the water column during storms in late 2007, according to one study, and bottom water temperatures on the mid-shelf increased by more than 3°C (5.4°F) compared to the long-term mean.
Another study finds that drastic sea ice shrinkage causes increase in storm activities and deepening of the wind-wave-mixing layer down to depth ~50 m (164 ft) that enhance methane release from the water column to the atmosphere. Indeed, the danger is that heat will warm up sediments under the sea, containing methane in hydrates and as free gas, causing large amounts of this methane to escape rather abruptly into the atmosphere.
Would this heat be able to penetrate sediments?
Since waters can be very shallow in the Arctic, much of the methane can rise up through these waters without getting oxidized.
Shakova and Semiletov warn, in a 2010 presentation, that some 75% of the East Siberian Arctic Shelf (ESAS) is shallower than 50 m, as shown on the image below. Furthermore, the ESAS region alone has an accumulated methane potential of some 1700 Gt in the form of free gas and hydrates under the sediment, in addition to organic carbon in its permafrost.
As the methane causes further warming in the atmosphere, this will contribute to the danger of even further methane escaping, further accelerating local warming, in a vicious cycle that can lead to catastrophic conditions well beyond the Arctic.
Above image shows the carbon in the melting permafrost, estimated by Schuur et al. at 1700 Gt. Much of this carbon could also be released as methane under warmer and wetter conditions.
Under warmer and dry conditions, things wouldn't be much better. The 2010 heatwave in Russia provides a gloomy preview of what could happen as temperatures rise at high latitudes. Firestorms in the peat-lands, tundras and forests in Siberia could release huge amounts of emissions, including soot, much of which could settle on the ice in the Himalaya Tibetan plateau, melting the glaciers there and causing short-term flooding, followed by rapid decline of the flow of ten of Asia's largest river systems that originate there, with more than a billion people's livelihoods depending on the continued flow of this water.