Another Heatwave Hits Arctic

As parts of Canada, Greenland and Russia are hit by -40 degrees temperatures (anomalies at the bottom end of the scale), parts of the Arctic are experiencing temperatures above freezing (anomalies at the top end of the scale), as illustrated by the image below.

[ click on image to enlarge ]
Temperatures in the Arctic are much higher than they used to be and this situation further accelerates warming in the Arctic, due to a number of feedbacks.

One such feedbacks has been coined the ‘open doors feedback’. Indeed, the situation is much like leaving the fridge door open. This allows cold air to more easily move out of the fridge, i.e. the Arctic, resulting in the cold temperatures over North America that have received extensive news coverage in the media. At the same time, warm air can move more easily into the fridge, i.e. the Arctic, and this is one of the reasons why the Arctic is hit by temperatures that are so much higher than what used to be normal.

The situation has been described in a number of earlier posts such as this one, as well in a recent interview with Jennifer Francis. As the Arctic warms more rapidly than the rest of the world, there's less temperature difference between the Arctic and the equator, resulting in the jet stream going around the globe at a lower speed with more elongated loops.

The left chart on above image shows such an elongated loop going north along the east coast of Greenland, then bending before Scandinavia and moving over the north of Greenland, then going around the North Pole and moving back to Scandinavia. This loop is not very visible on the chart, because the jet stream moves faster along straight tracks, and this chart highlights wind speed more than it highlights the path of the jet stream. Yet, the shape of this loop is very important, as it traps warmer air north of Greenland.

BTW, a weaker jet stream also elevates the chance of heat waves elsewhere, which can indirectly warm up the Arctic. Examples of this are heat waves over the Gulf Stream as it crosses the Atlantic Ocean, resulting in warmer water being carried into the Arctic Ocean, and heat waves over Siberia and North America, resulting in warming up of rivers that end in the Arctic Ocean.

Anyway, to get back to the current heatwave, there are a number of reasons why temperatures in the Arctic are so high at the moment. One of the biggest reasons is ocean heat, which has reached very high levels, especially in the North Atlantic, while the Gulf Stream keeps transporting warmer water from the North Atlantic into the Arctic Ocean (i.e. water that is warmer than the water in the Arctic Ocean). This warms up the seafloor of the Arctic Ocean, resulting in methane erupting from the seafloor, with a strong immediate local warming impact in the Arctic, thus further accelerating warming in the Arctic in another one of these self-reinforcing feedback loops, as pictured in the image below.


Further feedbacks that accelerate warming in the Arctic are discussed at the feedbacks page.

Without effective and comprehensive action, these feedbacks threaten to lead to runaway warming, i.e. abrupt climate change causing mass death and destruction, and resulting in extinction at massive scale, as depicted in the image below and as described in this earlier post.


In conclusion, the situation is dire and calls for comprehensive and effective action, as discussed at the Climate Plan blog.


IPCC too conservative?


Earlier this month, the Intergovernmental Panel on Climate Change (IPCC) released its 5th Assessment Report (AR5), stating that: "Surface temperature is projected to rise over the 21st century under all assessed emission scenarios. It is very likely that heat waves will occur more often and last longer, and that extreme precipitation events will become more intense and frequent in many regions. The ocean will continue to warm and acidify, and global mean sea level to rise. Many aspects of climate change and associated impacts will continue for centuries, even if anthropogenic emissions of greenhouse gases are stopped. The risks of abrupt or irreversible changes increase as the magnitude of the warming increases."

That does sound scary. So, what would happen if the IPCC's projections are too conservative? Could humans, together with many other species, go extinct within the next few decades? What are the risks that this could eventuate? Below follows an assessment using graphics by Sam Carana.


1. Ocean Heat

Below is what the IPCC says:


Below is a graph produced by Sam Carana, based on NOAA data. For more background, see this earlier post.


2. Sea level Rise

The image below shows what the IPCC says.


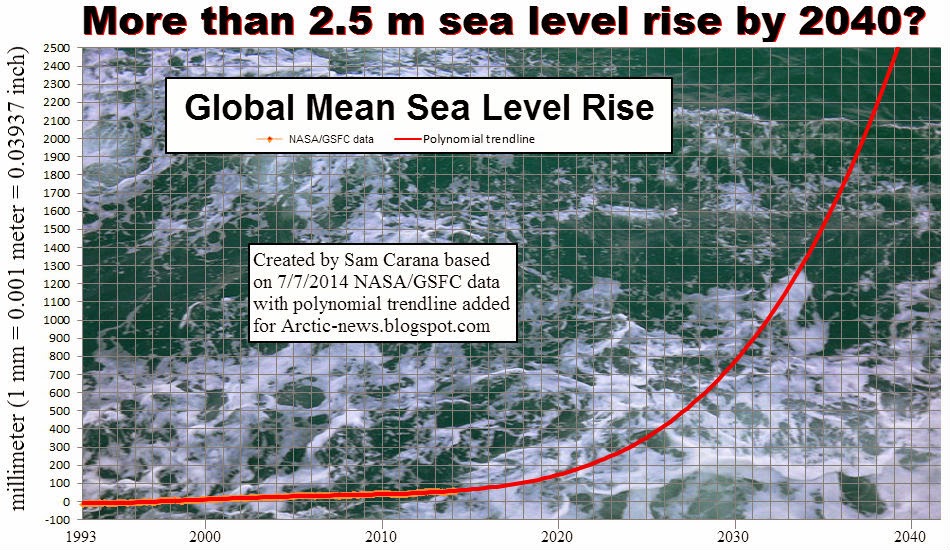
If ocean heat will continues to rise as pictured in the image by Sam Carana, then thermal expansion alone will cause more sea level rise than foreseen by the IPCC. Furthermore, extensive melting on Antarctica and Greenland can result in additional sea level rise. Below is a sea level rise graph produced by Sam Carana, based on NASA/GSFCs data, as discussed in this earlier post.


3. Arctic Sea Ice

The image below shows what the IPCC says.


If ocean heat will continues to rise as pictured in the image by Sam Carana, then Arctic sea ice will disappear much earlier than anticipated by the IPCC. An exponential trendline based on sea ice volume observations shows that sea ice looks set to disappear in 2019, while disappearance in 2015 is within the margins of a 5% confidence interval, reflecting natural variability.


A linear trend would be inappropriate, given the growing impact of feedbacks that can each be expected to reinforce sea ice decline, while there can also be interaction between these feedbacks, further accelerating sea ice decline. Albedo change is one such feedback, but there are numerous other ones, such as storms that have more chance to grow stronger as the area with open water increases.

In conclusion, an exponential trendline is more appropriate than a linear trendline, as also illustrated by above comparison, which shows that a linear trendline has 9 years fall outside its 95% confidence ionterval, versus 4 years for an exponential trendline. as discussed at the FAQ page.

Rapid decline of the snow and ice cover on the Northern Hemisphere is furthermore supported by rapidly rising surface temperatures over the Arctic, as well as greater intensity of heatwaves. Below is what the IPCC says on this.


Before further discussing surface temperatures, let's look into one of the feedbacks that could hugely increase temperatures, methane.


4. Methane

The IPCC appears to underestimate of the amount of methane that is contained in sediments under the Arctic Ocean and prone to be released as temperatures rise, as discussed in this earlier post and in this earlier post.

The image below, based on data from the IPCC and the World Metereological Organization (WMO), with an added observation from a NOAA MetOp satellite image, illustrates the recent rise of methane levels and the threat that methane levels will continue to rise rapidly.


When looked at from a longer range of years, above image fits in the black square on the image below.


As ocean heat keeps increasing and warming in the Arctic keeps accelerating due to feedbacks such as Arctic sea ice decline, huge methane eruptions from the seafloor of the Arctic Ocean threaten to push up methane levels even further. The image below shows exponential rise based on data of East Siberian Arctic Shelf (ESAS) releases alone, as discussed in an earlier post.


Non-linear rise is supported by the fact that methane's lifetime increases as more methane enters the atmosphere.


5. Surface Temperatures

The IPCC expects that, worst case, global average temperature could rise by 13 degrees Celsius by 2300, as illustrated by the image below.


The situation could be much worse than foreseen by the IPCC, due to the non-linear way feedbacks can hugely increase temperature rises.


The threat is that such rapid temperature rises will appear at first in hotspots over the Arctic and eventually around the globe, while also resulting in huge temperature swings that could result in depletion of supply of food and fresh water, as further illustrated by the above image, from an earlier post, and the image below, from another earlier post.


The situation is dire and calls for comprehensive and effective action, as discussed at the Climate Plan blog.